GIS: What it is and how to use it for historical research
The World
In recent decades, GIS, or Geographic Information Systems, has become a term widely found throughout landscape-based geographic and archaeological research. As an analytical tool, GIS fundamentally allows researchers to understand and model visibility and spatial theories regarding built or natural environments of past and present societies and cultures. Yet, these theories and the overall GIS-based jargon can be daunting to those unfamiliar with computational concepts of space and visibility.
Additionally, for historians, it can be difficult to understand how to computationally model past environments, events, and scenarios based on textual or pictorial evidence. Fret not. This post will serve as an introductory guide on how to incorporate GIS into historical research and where to access training materials. It will also provide further reading materials at the end for those wishing to learn more about concepts.
Where to begin: Spatial and Visibility Analyses?
The first step in using GIS as an analytical tool is understanding its basic principles. So, what are spatial and visibility-based analyses? Spatial analysis is concerned with how environments (rural and urban) are structured and why. For example, picture a hypothetical town in the medieval English countryside. The town consists of roughly forty households, a church, and a castle. On one end of the town, the castle sits behind a wall surrounded by deer parks and orchards. At the other end of the town, the church sits amongst the houses along the town’s main road. If one were to spatially analyse this layout, one might question why the castle sits away from the other structures and why houses cluster around the church. Is the castle separate from the town, or was it a later addition to the town’s infrastructure? What factors influenced these building decisions, and why were they influential? Using the same example, one could analyse visibility from inhabitants and travellers moving to and from the hypothetical town. These questions might include, though the castle sits away from the main route, could travellers see it upon their arrival? Were there specific buildings that were hidden from those moving along the main route, such as livestock pens for butchers or blacksmiths?
Terminology
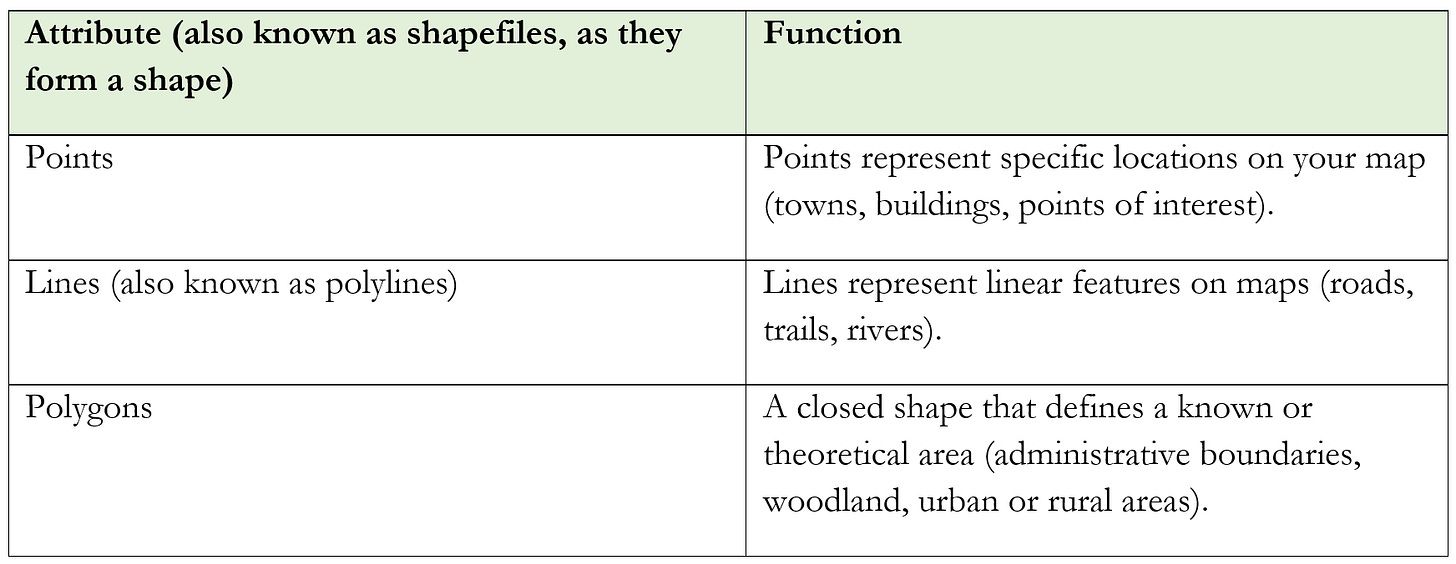
Now that we know some general questions and basic principles of GIS analyses, how does one navigate the terminology? The tables below outline the most common GIS terms that form the basis of any and all analyses. The first table outlines ‘data formats’ that are commonly used as bases for models or maps (also called basemaps or baselayers), while the second table contains information on commonly used attributes (ways of outlining or defining areas of interest).
Gathering Data: Where to find it?
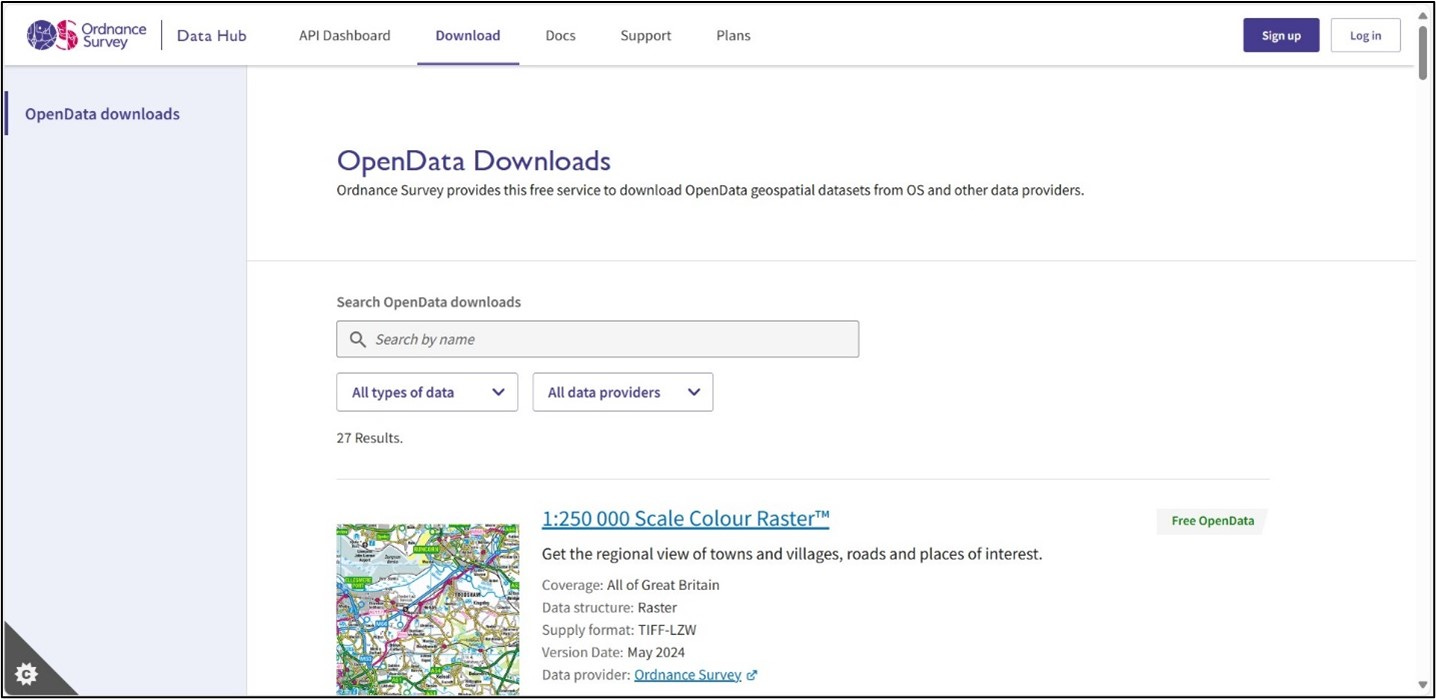
For visibility analysis, one would need to construct a viewshed (an area that can and cannot be seen from a specific point). To generate a viewshed, you first need to gather landscape and elevation data or, as it is commonly known, LiDAR (Light Detection and Ranging). These datasets come in varying styles but, ultimately, supply you with the same information. The most common styles are DTM (Digital Terrain Model) and DSM (Digital Surface Model); DTMs show you the terrain absent of buildings, modern surfaces, and vegetation, while DSMs retain this information. For the United Kingdom, LiDAR data can be freely downloaded from the DEFRA (Department for Environment Food & Rural Affairs) and Ordnance Survey OpenData databases; most government agencies have some form of free LiDAR data that a simple Google search will uncover. If your research is more large-scale (i.e., county, regional, or national) then use OpenData. For smaller-scale research, DEFRA or Digimap would be a great fit.
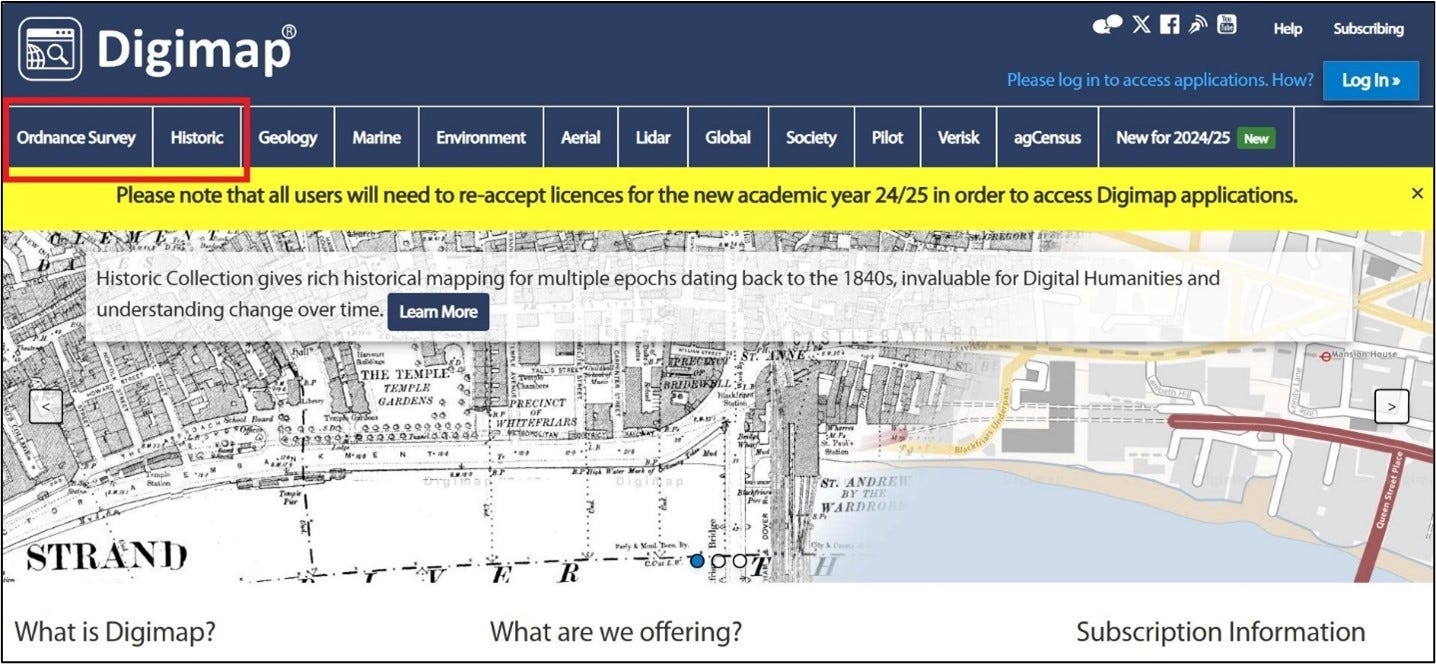
If you wish to incorporate a map, specifically an Ordnance Survey map, as a base layer, you can find all editions on the Digimap database. Note: this database is free for university students and staff. Digimap has varying categories of information, including LiDAR data and present-day Ordnance Survey maps, which can be found under the ‘Ordnance Survey’ tab. You can find the first or other editions under the ‘Historic’ tab. If you are looking to use a specific historical map, look to see if an archive has digitally scanned its collection or would be willing to scan a specific item. If not, you can geographically reference (georeference) a JPEG image by following one of the many tutorials found online.
Defra Survey Data Download. Contains public sector information licensed under the Open Government Licence v3.0.
Digimap homepage, https://digimap.edina.ac.uk/
Ordnance Survey Open Data Downloads, https://osdatahub.os.uk/downloads/open#:~:text=Ordnance%20Survey%20provides%20this%20free%20service%20to%20download
If there are specific research scenarios you wish to model or map, such as travel in early Medieval England, a general Google search will typically bring up any GIS data made public by funded research projects. For the above travel scenario, you can find accessible GIS data regarding documented bridges and fords on the Bridges of Medieval England to c.1250 online database. The Historic Environment Records, Archaeology Data Service, ArcGIS online, the National Library of Scotland, Ordnance Survey OpenData, and various other government and heritage agencies are also fantastic resources for historic GIS data that span most pre-historic and historic periods.
Uploading Data to Software Systems
There are two widely used GIS software systems, ArcGIS (typically labeled ArcMap or ArcPro depending on user license) and QGIS. These systems have their pros and cons, but they differ by users. If you are not tied to an organisation and its funds, then QGIS might be a better choice as it is free to download and use. It is up to you which software suits you best. Once you have made your selection, there are endless tutorials online that will walk you through how to upload and model your data to produce effective maps for analysis. YouTube is your friend…trust me!
GIS-based anything is a skill that requires practice, time, and patience. You might struggle with it from time to time, but it will get easier with practice. Remember, historical events and scenarios were processes that continuously changed depending on social, political, economic, and global factors. Your model is a snapshot of a moment in time, highlighting specific factors that are pertinent to your research, so you need to address this in your analysis and possibly make more than one map to show different views/timelines. Take the time to explore the databases and ways to display your data (ArcGIS has a wide range of pre-made baselayers that might help you). Have fun with it and make it your own.
Alison Norton is a trained GIS specialist and a medieval historian and archaeologist. Her interests lie in medieval English castles, the medieval landscape, Norman Conquest, GIS and LiDAR.
References and Resources:
Online Resources
Digimap,
https://digimap.edina.ac.uk/
National Library of Scotland,
https://maps.nls.uk/
Ordnance Survey Open Data Downloads, https://osdatahub.os.uk/downloads/open#:~:text=Ordnance%20Survey%20provides%20this%20free%20service%20to%20download
Archaeology Data Service,
https://archaeologydataservice.ac.uk/
Historic Environment Records, https://howtohistory.substack.com/p/using-the-heritage-environment-record
Further Reading
K. Lilley and C. Porter, “Research methods for history: GIS, spatial technologies and digital mapping,” in Research Methods in History, 2nd edition, eds. S. Gunn and L. Faire (2016), 125-146
J. Connolly and M. Lake, Geographical Information Systems in Archaeology (2006).
D. Wheatley and M. Gillings, “Vision, Perception and GIS: Developing Enriched Approaches to the Study of Archaeological Visibility,” in Beyond the Map: Archaeology and Spatial Technologies, ed. G. Lock (2000), 1-27.
M. Llobera, “Life on a Pixel: Challenges in the Development of Digital Methods within an “Interpretive” Landscape Archaeology Framework,” Journal of Archaeological Method and Theory 19 (2012): 495-509.
M. Monmonier, How to Lie with Maps, 3rd Edition (2018).


Fascinating article on geographical information systems - mapping - and how to use various forms and where to find them on the digital sphere. Thanks for taking the time. Lots to delve into.
This is excellent! You might be interested in my recent newsletter about archival methods. Situating in place is helpful for understanding cultural or historical events and stories.